Select a region


The length of time that women can expect to live a healthy life from birth has fallen by more than eight years in Jersey, while a woman’s ‘healthy life expectancy’ in Guernsey is lower than a man’s.
The data has been revealed in Jersey’s Opinions and Lifestyle Survey and Guernsey’s recently published Mortality Report.
While in Guernsey a woman can expect to live longer than a man, the healthy life expectancy was 64.5 for men and 63.2 for women.
In Jersey, female ‘healthy life expectancy’ at birth fell between 2016–2018 and 2020–2022 from 69.7 years to 61.2 years, while the figure for men declined from 66 by 1.6 years during the same period.
The UK defines ‘healthy life expectancy’ as: “...an estimate of the average number of years babies born this year would live in a state of ‘good’ general health if mortality levels at each age, and the level of good health at each age, remain constant in the future.
“Similarly, healthy life expectancy at age 65 is the average number of remaining years a man or woman aged 65 will live in ‘good general health’ if mortality levels and the level of good health at each age beyond 65 remain constant in the future.”
Guernsey’s Director of Public Health, Dr Nicola Brink, said the rate is calculated as follows:
"Healthy life expectancy takes our mortality rates and an individual’s self-reported health status – that then gives us our healthy life expectancy.”
It should be noted that the inverse is true for healthy life above the age of 65.
In Jersey for example, for people who have reached the age of 65 in the 2020–2022 period and are still in good health, healthy life expectancy has not changed significantly since the previous calculations, and healthy women can expect a slightly longer period of continued good health – 13.1 years compared to 11.6 years for men.
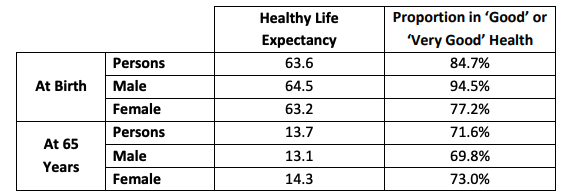
This is similar to Guernsey, where “healthy life expectancy at 65 was 13.7 years overall; 13.1 years for males and 14.3 years for females” according to Public Health.
One argument for the disparity between healthy life expectancies at birth is the method of collection for the figures, as it is all collated through self-reporting.The expectancy is sensitive to the “proportions reporting themselves in ‘good’ or ‘very’ good’ health for the youngest age band (15-19)” according to Guernsey’s Public Health.
“This result is used to make as assumption about the self-reported health for those aged 0–14. In addition to this, the sample size from which the assumption is based is also small.
“This could be a source of volatility in future estimates as changes in how a small number of respondents in the 15–19 age band respond to the self-reported health question may have a large influence on the proportions used in the healthy life expectancy calculations.
“Confidence intervals for the Guernsey healthy life expectancies are relatively wide. They range 2–3 years above and below the estimates shown.”
Jersey’s O&L Survey acknowledges a degree of imprecision around the figures as well. It says the latest difference of just over three years in healthy life expectancy between males and females is not ‘statistically significant’.
When asked, Guernsey’s Director of Public Health said the figures conversely feed into concerns about men’s health.
"What you see from our data... is that life expectancy for women is higher than men, and is up in the 80s, while healthy life expectancy is within the 60s, and men have a better healthy life expectancy than women,” said Dr Nicola Brink, referring to a life expectancy at birth for men of 81.2 and 85.5 for women.
"The question we've got to ask ourselves is what happens over the period of time between.Why do women have a higher life expectancy but a lower healthy life expectancy? The converse is - why do men have a higher healthy life expectancy but a lower life expectancy? So, we actually have to ask ourselves if this is related to men not coming forward for screening, not coming forward for medical attention...
“What barriers are in place to stop men accessing care? Now, that's also reflected in our avoidable mortality.
“Because, as I'm sure you're aware, the avoidable mortality is higher for men than women. Now, the important part of looking at mortality and looking at trends and mortality is it provides us with an evidence base to inform our policies and decision making.”

Alternatively, Jersey’s ‘Mrs Menopause’, Trudi Roscouet, suggests that lifestyle and socio-economic issues have a “huge part to play”.
Ms Roscouet has years of experience in the health and fitness industry and specialises in women and children’s fitness.
She said: “Women have a much higher risk of heart disease and it is the biggest killer in females. Increased stress, poor diet and sedentary lifestyle all play a major part.”
Jersey’s Public Health director Professor Peter Bradley said the decline in Jersey could be related to a number of different issues but added that “some possible explanations” included “additional pressures on women through the pandemic and the current cost-of-living crisis”.
“These events may be making life challenging for Islanders, especially those with families, and may be affecting their health and wellbeing. Other factors could be higher alcohol consumption rates, or the long-term health impact of smoking, which, according to UK data, has contributed to the rise in lung cancer cases in women,” he said.
While Guernsey and Jersey both boast high overall life expectancies compared to the UK, Public Health Guernsey said that healthy life expectancies are more mid-range.
“The male figure for Guernsey is similar to the South West, East of England and London regions but slightly lower than the South East and Jersey,” said a spokesperson for Public Health.
“Jersey’s healthy life expectancy was 1.9 years higher than Guernsey’s for males. This figure for Jersey is due to be updated this year. For females, Guernsey has a similar healthy life expectancy to England but is higher than the other UK countries."
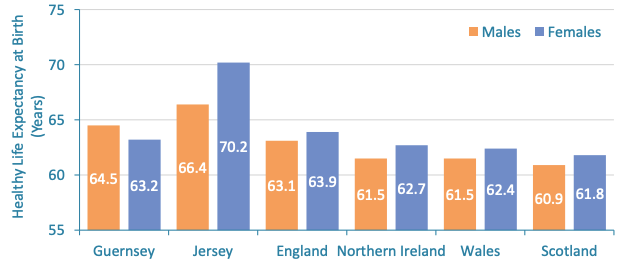
Pictured: Figures for Jersey (2016-2018), UK countries (2018-2020) and Guernsey (2019-2021).
“The female figure for Guernsey is similar to the West Midlands and North West regions. It is lower than the South West, South East, London and East of England regions. Jersey’s healthy life expectancy was 7.0 years higher than Guernsey’s for females.
“In statistical terms, this is likely to be a true difference. This figure for Jersey is due to be updated this year. As noted above, the healthy life expectancy is quite sensitive to the self-reported health result for age band 15–19, which was relatively low for females in Guernsey compared to Jersey.”


Comments
Comments on this story express the views of the commentator only, not Bailiwick Publishing. We are unable to guarantee the accuracy of any of those comments.