

It's widely accepted that a number of varying factors can leave people living in poverty with a States report published this week laying bare the local picture.
Contributing factors range from education attendance and attainment, levels of crime, affordable housing, employment figures, and environmental impacts such as pollution.
Express has broken down the report - HERE in full - so you don't have to.
Income and Benefits
The report opens up with statistics on the amount of people receiving benefits in terms relative to Guernsey's population, and how much of the population is sitting below the median earnings per household by a significant portion.
Anyone earning below 60% of median earnings is considered to be at risk of poverty.
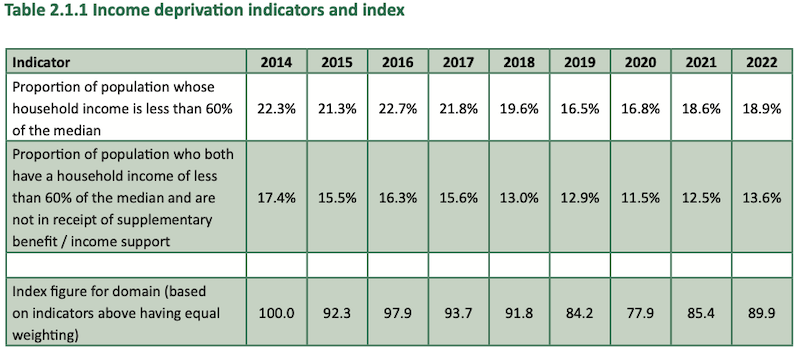
This 60% figure itself is mobile, with the actual amount in monetary terms having dropped from £22,318 in 2020, to £21,936 in 2022.
That drop could be partly responsible for the increase in indicators, which focus on people who drop below that mark. Although there are more people with household income less than that magic number, now at 18.9%, climbing 0.3% on the year, and 2.1% since 2020, there are still fewer people who are in this group receiving support from the states.

Pictured: The States of Guernsey's figures show how things have changed over the past decade when it comes to income and potential support offered.
The percentage for the number of people who receive less than the 60% figure, and are not in receipt of benefits or income support increased, has gone up to 13.6% from 12.5% the year before, and 11.5% the year before that.
More children are missing school, dropping grades, and more parents need help to purchase uniforms according to the latest data.
The report makes it clear that Guernsey is following a worrying UK trend which sees fewer children attending classes, and an increasing absence rate. This takes into account sick days and unauthorised absences.
That figure grew from 13.5% to 13.9%, but in doing so, the amount doubled compared to pre-pandemic years.
The number of approved applications for uniform grants also creeped up to 14.9%. Besides 2021, when the figure was obtained through teacher assessment rather than examinations, that’s a peak compared to any other year, although this data does tend to fluctuate a little more than other statistics presented.
The number of 16 year olds who are not in education, employment or training has also seen a slight increase to 3.5%. That number shot up during the pandemic and although it’s seen a slight decrease over the past couple of years, 2023 saw a little increase of 0.1%.
There are also more school children not reaching the results expected of them, although last years figures are a bit of an anomaly as they don’t include the Ladies’ College, Elizabeth College, or Blanchelande College, nor St Anne’s School in Alderney.
The attainment figure stayed static at 9.4%, taking into account those who don’t get graded 9 - 1 across five GCSEs, or the equivalent at Key Stage 4.
Fewer thefts, burglaries and cases of criminal damage were reported locally in 2023, but violent crime was on the rise.
The number of burglaries per 10,000 of the population sits at 11, a five year low with a continuing downward trend, after the number reached 17 in 2018.
Theft is also down to 53 from high of 76, per 10k population, while cases of criminal damage saw a similar fall off from 72 down to 58. However, violent crime is on the rise.
Pictured: Police are dealing with fewer cases of burglary, theft and criminal damage, but the worrying trend of increasing violent crime is continuing.
In 2018, that figure per 10k population was 114 cases. That grew to 142 pre-covid, but then dropped back down to 131 while everyone was under covid lockdown procedures. That slowly rose year on year, to 136 then 139, but it’s now shot up to 151.
That means last year there were over 900 incidents of violent crime locally.
This is notable as areas with higher levels of crime also have higher rates of poverty.
Rent is costing more, as is well document, but affordability is showing early signs of improving according to the latest available data.
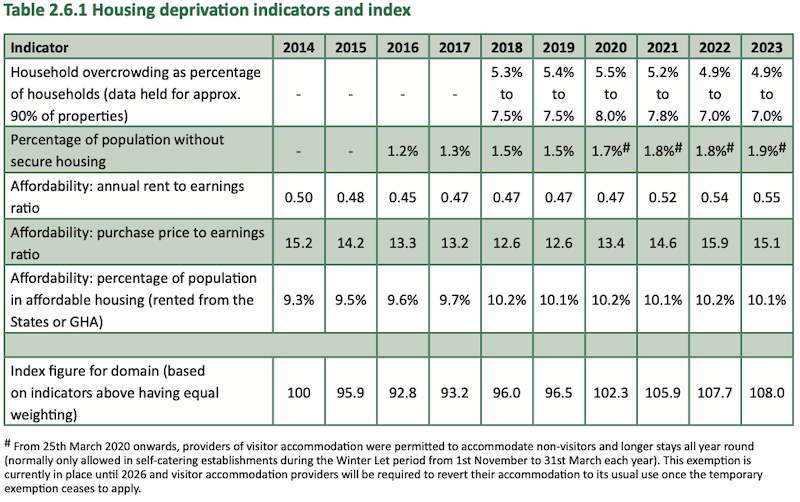
In terms of rental accommodation, the figure is at 10 year high. When comparing the annual rent to earnings ratio, it’s slipped into the negative to renters for the first time, costing more than half the available earnings for households.
The figure they give is 0.55, meaning the other 0.45 is all that stays with the renter. This number was in favour of those renting up until 2021, but then post-covid, it slipped to favour landlords.
The States reached these figures with a mix-adjusted average of the private rental payments, compared to median individual employment earnings.
The cost of owning a home took a drop in 2023 when compared to the year before, but it’s still incredibly high, with a ratio of 15.1. This is about the same as 10 years ago in 2014, but it had been steadily dropping until the pandemic, when it increased rapidly.

Pictured: The figures provided by the States of Guernsey show that there are more of us living in accommodation rented from the states, and it's getting more expensive to rent in general.
There are also more people living in accommodation rented from the States or the GHA, when compared to a decade ago, although that has stayed fairly static since 2018.
Prior to that it had been climbing steadily at 9.3% in 2014, 9.5% in 2015, and 9.6% in 2016, and so on. However this hit 10.2% five years ago, where it has bounced between that figure, and the one for 2023, 10.1%, ever since.
This takes in account everything from Sulphur Dioxide pollution to housing complaints and road traffic accident injuries.
When it comes to pollution levels, Sulphur Dioxide levels seem to be a major success story for Guernsey, dropping from a high of 12.2μg per m³, down to just 1.7. Some of the main sources of SO2 emissions are electricity generation, industrial and domestic fuel combustion.
Nitrogen Dioxide however has risen. NO2 mainly comes from the combustion of fossil fuels (coal, gas and oil), as well as welding, using explosives, refining petrol and metals, commercial manufacturing, and food manufacturing. It now sits at 15.0 which has increased for the previous two years, but is much lesser than levels prior to the covid pandemic. They were highest in 2014, and have been dropping steadily since, with a few rising years along the way, mainly in 2018, 2019 and last year.
Serious injuries caused by road traffic accidents have stayed lower than pre-covid levels too. They were always firmly in the double digits, they dropped significantly during the lockdown, and then have been on a steady rise since, but there are still less cases than before the Covid-19 pandemic.
Comments
Comments on this story express the views of the commentator only, not Bailiwick Publishing. We are unable to guarantee the accuracy of any of those comments.