

With Guernsey's rate of inflation doubling in a year, and hitting a high point not seen since the 1990s you may be wondering what it means for you.
With a breakdown of the key statistics, we start with what does inflation actually mean?
The Bank of England says "inflation is the term we use to describe rising prices. How quickly prices go up is called the rate of inflation."
This definition is echoed by every major financial institution across the world, with the International Monetary Fund saying "inflation measures how much more expensive a set of goods and services has become over a certain period, usually a year".
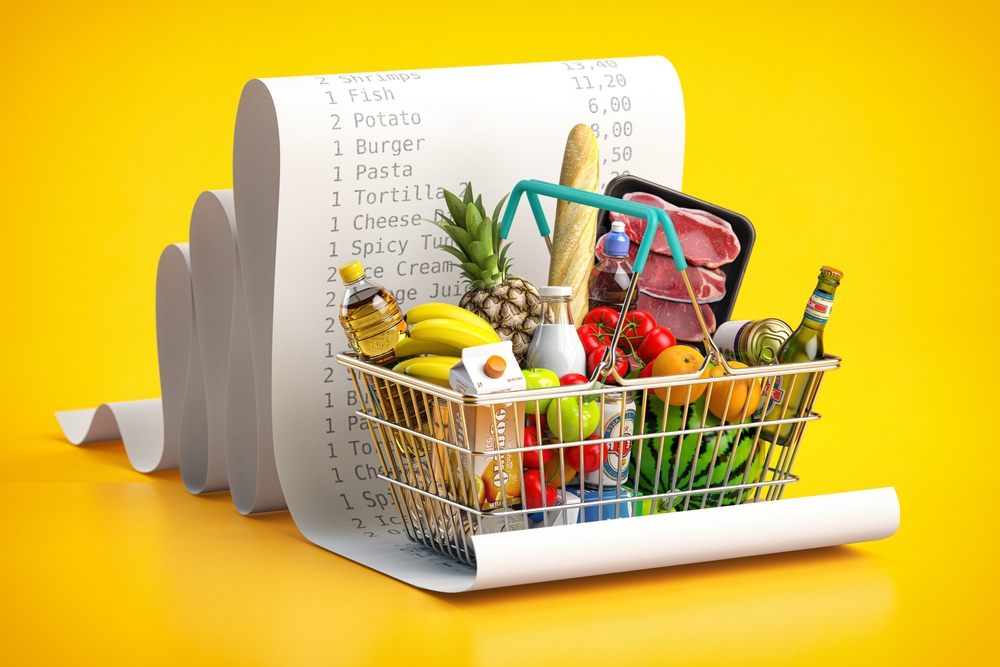
Inflation is measured by government agencies around the world conducting a variety of household surveys expenditure. This is commonly done through monitoring the cost of a basket of popular items bought during a weekly household shop.
Any rise and fall in the price of the goods within that basket is used to track the rate of inflation.

Pictured: The rate of inflation is commonly monitored by comparing the costs of a basket of shopping at different times over the course of a year, and years.
Guernsey's rate of inflation at the end of September 2022 was calculated using a new method which also monitors a set of Household Cost Indices (HCIs).
These HCIs have been released alongside more commonly used indices such as:
Data under each of these sections can be downloaded from the States website HERE.

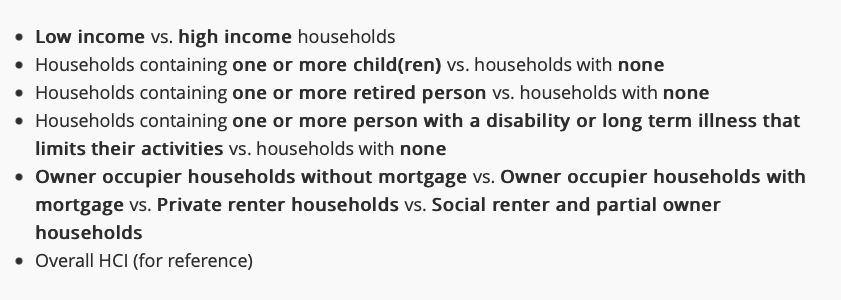
Pictured: The HCIs, introduced for the first time this month, cover the expected differences in expenditure between different households, as listed.
The new HCIs have been designed to "aid understanding of the differences in rates of price inflation being experienced by different types of household in Guernsey".
Those different types of household cover "low income vs high income" and households with varying numbers of children, or no children, older people, younger people, owner-occupied households, private rentals, social rentals and partial ownership households.
The number crunchers at Frossard House used different measuring tools to gauge how inflation rates affect the different household types.
They said that "to give lower spending households the same level of representation within the figures as higher spending ones, the weights for the HCIs are calculated using a different method to that used for the RPIs".
Each HCI was viewed through the same table of items with different items selected based on what the household type would be expected to typically buy.
Explaining the methodology, the number crunchers said that goods and services were further split into "staple" and "additional" groups.

Pictured: Spending on staple and additional goods and services are calculated.
The rate of inflation shows increases across all areas of spending most common in all households.
The cost of electricity pushed up the cost of heating and lighting homes by 4.5% over the past year.
Spending on food went up by 3% due to increased costs across seasonal fruit and vegetables, as well as ready meals, meat and dairy products.
Shop bought alcohol saw an increase of 1.9% under the RPI, while tobacco went up 0.3%.
Price increases across various items resulted in a 2.5% increase in RPI for clothing and footwear.
Leisure goods and leisure services went up by 3.7% and 2.4% respectively - covering the cost of a variety of products including plants, toys, computers, barbecues, headphones, gym membership and holiday insurance premiums.
Expenditure on motoring decreased but 0.7% RPI over the past year with petrol and diesel price reductions over the summer months the main contributory factor compared to the record high prices seen earlier in the year.
Inflation more than doubles in a year
Inflation latest due out today
Survey finds half struggle to meet living costs
Annual inflation highest since 2008
Comments
Comments on this story express the views of the commentator only, not Bailiwick Publishing. We are unable to guarantee the accuracy of any of those comments.